
Dashboard design & build
Dashboards designed for the people using them, from executive summaries to detailed operational views.
Dashboards, plus the maintenance guide for them
03 / 04·Business intelligence & reporting
Next: Web & digital analytics03 / 04 · Defined build, then monthly
We build dashboards and reports around the decisions your team needs to make. Agreed definitions and checked data help everyone work from the same figures.
Example
A KPI dictionary records what each measure means, who owns it and its target. These examples show the format.
Artefact
Example
Measure · Definition · Owner · Target
What we do
Dashboards designed for the people using them, from executive summaries to detailed operational views.
Dashboards, plus the maintenance guide for them
Agreed measures, definitions and targets for your team's reporting.
Documented KPI definitions, owners and targets
Reports that update from source systems on a schedule, reducing manual preparation.
Scheduled data updates and reports
Board reports with checked figures, performance trends and commentary.
A board reporting template
How it runs
What decisions this reporting needs to support, and who makes them.
Measures, definitions, owners and targets, agreed in writing.
The KPI dictionary
Built in the tool you already own — Power BI, Looker, Tableau or Metabase.
Connect the data sources and schedule report updates.
Review usage and feedback during the first month, then refine the reports and hand them over.
The dashboard, plus an adoption note
Working with us
Fit
This works when
Before you start
FAQ
Power BI, Looker, Tableau and Metabase most often. We build in the tool you already own rather than migrating you to a new one, unless the assessment says otherwise.
Often, yes. We review the data sources, definitions and dashboards to decide what can be repaired.
We typically define five to ten KPIs and show up to seven in a single view, depending on the decisions it supports.
Your team can use the maintenance guide, or we can maintain and improve the reports through ongoing support.
Reading
· Analytics & tracking
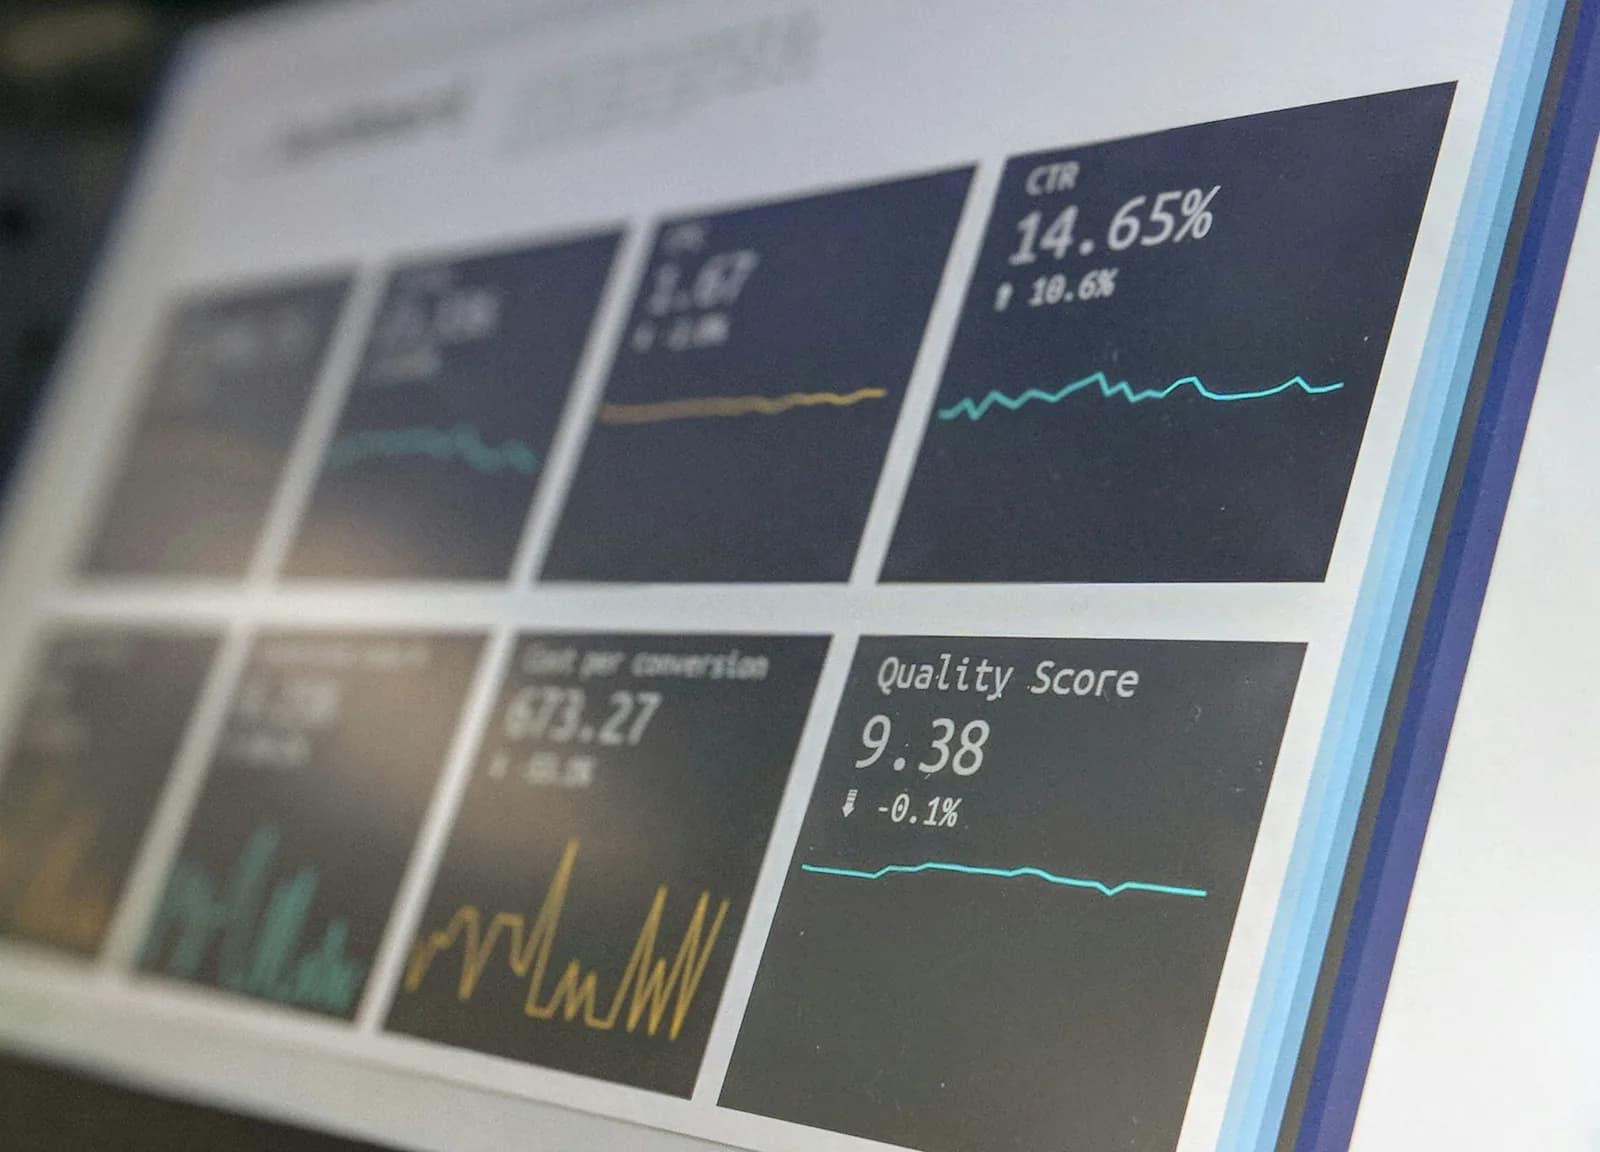
How to choose a manageable set of KPIs and keep your dashboard focused on the decisions it needs to support.

· Digital performance
Targets can encourage behaviours that improve a metric while harming the business. How to review the incentives and context behind your KPIs.

· Digital performance
Start with the decision your team needs to make, then identify the data and analysis required to support it.
Services
Book a call to discuss a new dashboard or improvements to your existing reports.