Why your AI visibility score swung overnight (and the 3 numbers that matter)
AI visibility scores vary between runs. How repeated checks and consistent reporting help distinguish trends from daily variation.
Here's a question we keep hearing from in-house marketers, usually with a slightly exasperated sigh. "How do I actually measure this? Every tool gives me a different number."
If that's you, take some comfort. You're not doing it wrong, and the tools aren't broken. AI search has quietly become a place where your buyers research, compare, and shortlist, and most teams are now trying to track how their brand shows up inside ChatGPT, Perplexity, Gemini, and Claude. The trouble is that the number you get back tends to jump around like a toddler on a sugar high. This post explains why it moves, and the three numbers that are actually worth putting in front of your boss.
Your score really is moving, and it's not your fault
Let's start with the uncomfortable truth. Your AI visibility score isn't a fixed fact you can look up. It's a fresh answer the engine makes up each time you ask. So the same question, asked twice, can name different brands in a different order with different sources behind them.
How wobbly is it? When Rand Fishkin's team ran nearly 3,000 identical queries through AI models in 2026, the odds of getting the same ordered list of brands twice were under 1 in 1,000 (Search Engine Land, 2026). On top of that, 40% to 60% of the sources these engines cite change from one month to the next (Search Engine Land, 2026). The floor keeps shifting, so the number standing on it keeps shifting too.
One example made the rounds in the marketing community this year. A single brand's share of voice for one prompt read 25% in the morning, 63% by lunch, and 43% by the evening. Same engine, same question, same day, no change to the brand at all. That's a 38-point swing while everyone was at their desks. If you'd screenshotted the morning number for a report, you'd have told a very different story than the lunchtime one.
Compare repeated readings
Here's the reframe that fixes everything. Checking your AI visibility once and reporting it is like glancing at the thermometer at noon and declaring the climate. You've measured something real, but you've measured the weather, not the climate.
The fix is to stop trusting any single reading. Run the same set of buyer questions many times, on a regular schedule, and report the average and the direction of travel. Research on measuring AI search in 2026 lands in the same place. Treat your visibility as a range, not a single figure, and run a fixed panel of prompts week after week. Do that, and the random daily noise cancels itself out, leaving the signal you actually care about.
Think of it like a political poll. Nobody calls an election on one phone call. They ask a few hundred people, then report the result with a margin of error. Your AI visibility deserves the same treatment, because it's exactly the same kind of measurement. It's a sample of something that's always moving.
The only 3 numbers worth taking to your boss
Once you measure properly, you don't need a wall of charts. You need three numbers, and each one answers a question your leadership team is actually asking.
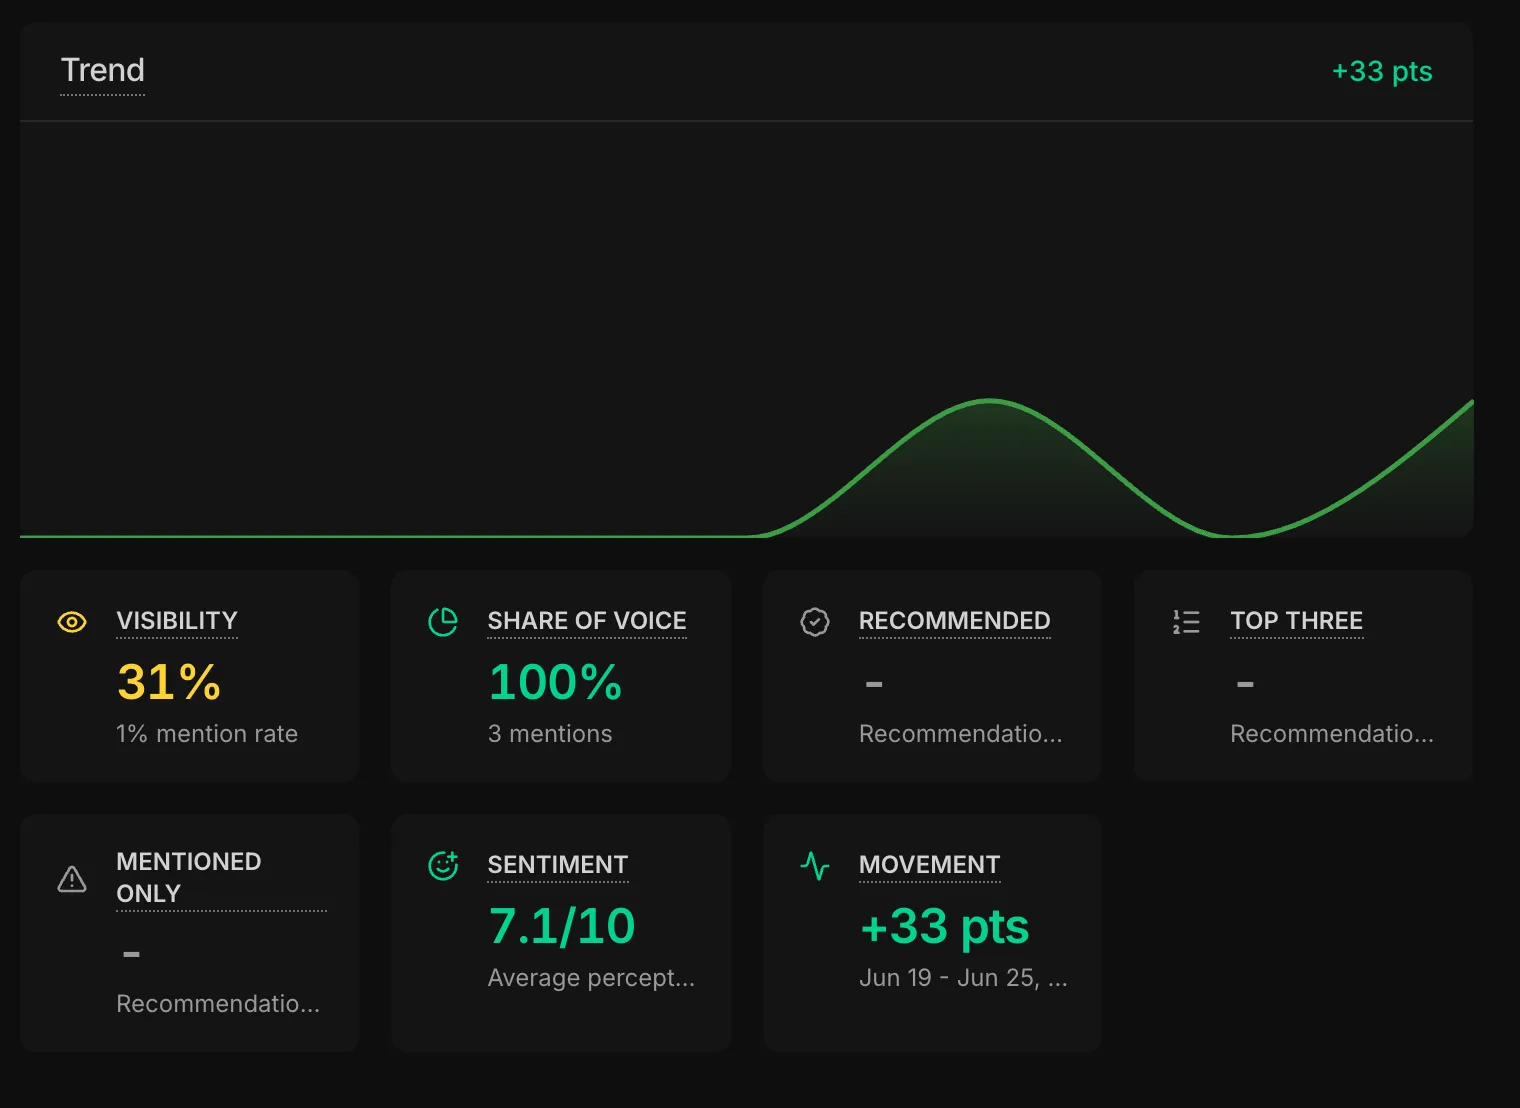
1. Citation-frequency trend. This is how often your brand shows up across your set of prompts, tracked over weeks rather than days. The direction is the story. A line climbing month on month means your work is landing. Any single week's figure could be the morning 25% or the lunchtime 63%, so don't report the dot. Report the line.
2. Share of voice, averaged across many runs. This is your slice of all the brand mentions for your buyers' questions, measured against your named competitors, then averaged across every run in the period. The averaging is what makes it trustworthy. It turns a jumpy daily number into a steady read on whether you're gaining or losing ground against the rivals a buyer is weighing up.
3. Cross-model consistency. This is whether the engines agree about you. If ChatGPT, Perplexity, Gemini, and Claude all name you for a question, your visibility is solid. If only one does, you're one source change away from vanishing. This number tells your boss how dependable the other two are.
Three numbers, each one a trend or an average with a sensible range around it. That's a report a finance-minded leader will actually believe, because it behaves like every other metric they trust.
How we'd set this up
This is the gap we built our AI brand visibility tracker, Cleotic, to close. Cleotic runs your prompts across the major AI engines every week, records every brand named in every answer, and reports those three numbers as trends with the actual answers behind them. No screenshotting a lucky Tuesday and hoping nobody asks.
If you'd like to go a level deeper before you start, two companion reads are worth your time. One explains why every AI engine describes your brand differently, and the other unpacks why share of voice beats a simple mention count when you're trying to prove you're winning.
The practical starting point is straightforward. Write down 20 to 30 questions your buyers genuinely ask, run them many times across the major engines on the same schedule each week, and report only the three numbers above. Then ignore the daily noise and watch the direction.
Report trends across repeated checks and keep the questions, engines and schedule consistent. Investigate sustained changes instead of treating every daily movement as a result.